The Music C•A•R•E•S CO₂ calculator determines selected, relevant greenhouse gas emissions of your event and can display the CO₂ results of the various areas. In collaboration with the life cycle assessment experts at myclimate, we developed the underlying formulas, which include publicly available emission factors.
1. Overview
Below you will find some explanations in order to transparently present decision-making processes regarding the approach, the structure of the user query and the type of calculations of the CO₂ calculator. As the project has so far been dependent on irregular and unplannable funding rounds, it is in ongoing development - as is this transparency statement. The aim of the Music C•A•R•E•S tool is to enable music events to be implemented more sustainably - as quickly and easily as possible. This is achieved by combining a CO₂ calculator - to quickly and easily reduce or avoid emissions - With consideration of social sustainability (currently being developed) and a directory of suitable providers. The list of providers is still exemplary and criteria for inclusion in the list will be developed in the course of 2025. In general, the tool is intended to show that the cost-benefit ratio of music events can be optimized and that more sustainable action is possible.
With the CO₂ calculation, we are pursuing a pragmatic approach through which the use of the tool is intended to benefit the real everyday life of event organizers - an introduction to the complex processes of sustainability and reporting or documentation:
- To show concrete options for action to reduce emissions, which are also realistic for small and medium-sized players
- To make it easier to put existing knowledge into practice as quickly as possible - through the broadest possible accessibility and targeted knowledge transfer, for example through info buttons etc.
- To create (more) attention and awareness for sustainability and to inspire new, creative solutions in the music industry.
Our focus is not on a highly detailed CO₂ calculator:
- Because they already exist and have relatively high barriers, whether financial or in terms of content.
- Because even comprehensive CO₂ calculators have differences in their calculations, as not all/the same areas are always recorded in the same way and calculated with the same emission factors
- Because a focus on CO₂ should not push other environmental impacts and issues such as resource management, biodiversity and social justice into the background. We are committed to avoiding greenwashing or purely symbolic solutions.
When creating the calculator, the decisions on the individual topics are based on freely available knowledge, e.g. the Cradle to Cradle impact matrix (source as of 11.09.23) as well as our many years of experience and contacts from the Berlin music event business. In collaboration with the life cycle assessment expert from myclimate, we developed the model (formulas and appropriate emission factors) for the pilot version.
2. Areas & topics of the CO₂ calculator
Areas of the user query
Within the user query, criteria are asked which should be realistically changeable/implementable for organizers, so that a leverage effect for immediate savings in emissions is stimulated. Smaller, non-commercially run but socially valuable venues, for example, cannot be expected across the board to revise their entire infrastructure with sustainable but expensive innovations. In the pilot version, we initially focus on the most relevant areas (mobility, location, catering, merch); i.e. the areas that cause the most emissions with regard to music events (source: as of 30.01.2025)- this logic also continues for the sub-areas (e.g. for location: electricity & heat generation).
In addition, we have included some topics that are close to our hearts and that we would like to draw attention to, even if their CO₂ impact is not that serious (e.g. for location: waste, which should actually be a recyclable resource, or water). The tool is recommended for use before, during and after event planning. Ideally, it should be used repeatedly, for example for series of events, so that data and experience can be collected and individual goals can be set and evaluated.
Topic of accuracy of the calculations
The tool currently only takes into account a few selected emission sources, which theoretically limits the precision of the calculations. This limitation was initially due to the feasibility within the first funding round. However, due to the complexity and variability of factors such as supply chains or indirect emissions, it is not possible to fully capture all emissions from a product or service anyway. Instead, we use emission factors that reflect the average life cycle of typical activities and products at events (as of 2023). With the areas offered, the most relevant topics are currently satisfactorily covered for us as far as we can realize this within the framework of the funding provided to date. Should a more precise coverage of the areas or the inclusion of new areas be envisaged at another time, this could be possible, for example, through cooperation with relevant institutions (such as the Federal Environment Agency, ANKM cultural calculator, myclimate). The results displayed always depend on the assumptions made in advance, the available database and, last but not least, the individual decisions of the users. Depending on the type of event, it depends on where the priorities for selecting sustainable measures (should) lie. All calculations are therefore subject to uncertainties. This situation must be taken into account all the more for the example values: The example values provided are based on a limited data situation and are therefore only rough guide values without general application validity. Although the values have been calculated as systematically as possible, they do not represent exact average values for each specific number of guests, but provide a guide. They are not scientifically validated and may deviate significantly from the actual emissions.
Results view
In the results view, a donut chart first shows the proportional distribution of CO₂ emissions (in kg) for the mobility, location, merchandise and catering areas that can be selected in the user query (with or without using the example values). If an area has been skipped, i.e. nothing has been filled in, example values for the area or sub-area are automatically included. If you click on the individual areas in the 'Table' of the results view, you can see in more detail what the proportional distribution of CO₂ emissions in kg looks like within an area. Here in this mode/view, you can also see for which sub-areas the use of example values was selected (this is marked by an asterisk next to the number of kg).
3. Calculations: formulas and emission factors (EF)
It is firstly important to note that the term CO₂ used here is not entirely precise, as strictly speaking CO₂ equivalents (CO₂e) are included. The calculated values therefore include additional greenhouse gases, which are converted and summarized in CO₂ for better comprehensibility and readability with regard to their effect (source as of 11.09.23). The formulas are based on scientific methods and were developed in collaboration with a life cycle assessment expert from myclimate. The emission factors used for the calculations come from scientific sources and were provided to us by myclimate (as at 29.06.2023). The exact sources and calculation bases of the emission factors are publicly available and we can also provide our emission factor table on request.
Where necessary, we have adjusted the emission factors in collaboration with the life cycle assessment expert for the Music C•A•R•E•S tool. These emission factors are therefore based on sound scientific methods and are designed to provide a realistic estimate of CO₂ emissions for the respective activities. They are partly fuzzy and are also updated where possible. In the following, we will discuss the specifics of calculations, emission factors and the associated assumptions and decisions in order to make our approach transparent:
Mobility & Transportation - Guests:
- Assumption for car as a means of transportation: It is assumed that guests do not usually travel to the event alone in a car. The person-kilometer value therefore includes an average value for persons per car, with which the topic of carpooling/carpooling is included or mapped
- Assumption for calculating mobility by bike/walking: The distribution of kilometers covered is 50/50, i.e. it is an average of the two EFs
- Assumption for the EF of the means of transportation flight is that the guests arrive from within Europe
- At this point, the user query asks for a 'one-way' distance; in the calculation logic, this distance is automatically doubled in the background to include the return journey.
Mobility & Transportation - External Equipment & Infrastructure:
- The EF of vans here is based on the assumption that the vans are diesel-powered and weigh 3.5 tons
Mobility & Transportation - Artists
- For cars as a means of transport: Here the emissions are calculated with an EF that reflects the vehicle kilometers.
- Assumption of the same number of kilometers for all artists
- Assumption of a diesel bus double-decker for the calculation of the use of a tour bus/nightliner
- At this point, the user query asks for a 'one-way' distance; in the calculation logic, this distance is automatically doubled in the background to include the return journey
Location - Electricity
- Here, the consumption is calculated by dividing the total annual electricity consumption by the number of events per year in the respective location and multiplying by the EF. Of course, electricity is also consumed in locations outside of events, but this is not included here.
Location - Heat
- Assumption: no heating in summer, heating in winter
- Assumption of approximately the same number of events per month
Location - Waste
- We have prioritized residual waste for the pilot version, as this is not recycled or is largely incinerated.
- Acceptance: Disposal process is included in the residual waste
Location - Water
- Water was included as a topic because, despite its relatively low emission value, it is one of our most basic resources.
- Here, consumption is calculated by dividing the total annual water consumption in liters by the number of events per year at the location and multiplying by the EF.
- Of course, water is also consumed between events in venues, for example for cleaning. This circumstance is not included here.
Catering - Guests & Crew Food:
- The main aim here is to illustrate the difference between meat-based and non-meat-based dishes. Crew catering is calculated using real numbers of people or meals
- Assumption for vegan dishes: with meat substitutes
Catering - Guests & Crew Drinks:
- Soft drinks: EF applies to 0.33l soda
- EF for beer/wine applies to 0.33l beer
- EF for cocktails/long drinks is calculated from 0.2l soda + 0.2l rum
- Assumption for long drink: 50% non-alcoholic drink + 50% alcohol
Merch - T-shirts:
- The main aim here was to show the contrast in the calculation between a T-shirt made from conventional cotton and a T-shirt made from organic cotton. The emission factors used in each case offer a mere approximation, as the subject of textiles is very complex. For more information on different materials and labels, see: https://textileexchange.org/
Merch - Records:
- Assumption: The EF of a vinyl record used here is based on the EF of a DVD and was scaled by weight to a 12” vinyl record á 180g. This is used as an approximation.
4. Topic example values and tacho
The example values serve two purposes:
- Firstly, they simply make it easier to use the CO₂ calculator if a user does not have all the data and information to hand when filling it in. For a more accurate result, it is of course always better to enter concrete/real or at least realistic data for the event in question. However, you can also decide not to edit sub-areas or entire areas - in this case, an example value for a similar size of music events in Germany is automatically used for each query.
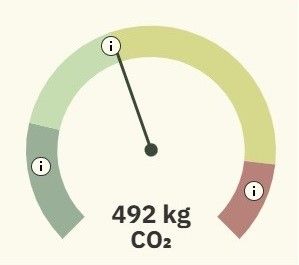
- Secondly, the sample values play a central role for the tachometer in the results view: The tacho is used to roughly classify the overall CO₂ result for the respective event within the German event landscape. This serves as an approximate orientation and gives users a feeling of where they stand with their own event.
The individual sample values in this pilot version are based on a mixture of data acquisition in the music event network and open source data from venues and events. The data situation (from Berlin sources) for the sample values was expanded and improved in spring 2025 with touring data collected from Kim Laber's master's thesis, in which the sample values were substantiated with Germany-wide figures from several events.
Users also have the option of an overall estimate of the event if they enter the number of guests and select the function of an example value for each area.
The respective example values were always created or (re)calculated for three event sizes. This prevents a higher number of visitors from automatically being rated more negatively.
- Small: 1-500 people (average value calculated on the basis of 300 people)
- Medium: 501-1000 people (average value calculated on the basis of 600 people)
- Large: 1001-2000 people (average value calculated on the basis of 1500 people)
Other assumptions and background information worth knowing on our part for various areas are used to calculate the example values as follows:
- GUEST MOBILITY: The example values given here do not include air travel. Assumption for Berlin values: 10km journey within the city, 169km journey from all over Germany
- MOBILITY OF ARTISTS: Even if the number of artists does not necessarily increase exponentially with the number of guests, it was assumed here that larger events often involve more artists. Values from master thesis only include information for sprinters/transporters. Berlin values were also calculated here for public transport, even if this is not (yet) an option in the user query at this point
- MOBILITY & TRANSPORT: external technology & infrastructure: Assumption (also based on low real Berlin value) that event venues usually have all relevant equipment on site and/or artists may bring the 'rest' with them and only the very large arenas/stadiums are supplied with full infrastructure
- LOCATION ELECTRICITY: Overall, conservative calculations were made here, i.e. real consumption values were converted into example values using the EF for conventionally produced electricity. Berlin value e.g. 111,000 kWh/year at 220 events/year (for approx. 750 guests location); everything roughly extrapolated via venue size, i.e. number of guests
- LOCATION HEAT: Assumption gas energy source (EF); e.g: Heat consumption of 108,000 kWh/year and 220 events/year (for approx. 750 guests location)
- LOCATION WATER: Due to lack of information from Berlin assumption of 17l water per person (source as of 16.01.25)
- LOCATION WASTE: Berlin value is 0.1kg residual waste per person, master's thesis study also has no primary information; assumes 1kg/person (as Klimaschutzstiftung BW specifies a value of 2kg waste/person, which is much too high based on real experience), assumption of fully filled waste garbage cans
- CATERING: The German wide values from the master's thesis only include real information from crew catering (food and drinks), but not from guest catering (these values are therefore estimated)
- CATERING Beverages: In the calculation of the example values for Berlin, the same assumption is made for guest drinks and crew drinks: distribution of 60% beer & wine, 25% water/soda, 15% long drinks with 2.7 drinks per person
- MERCH T-SHIRTS: Decision to use the EF for organically produced cotton despite minor ambiguity in the data for the German values from the master's thesis. The Berlin figures, however, are calculated conservatively, i.e. also real sales figures for T-shirts, but with the EF for conventionally produced cotton.
In the current pilot version, the sample values and the classification in the speedometer of the results view initially referred explicitly to the music event scene in Berlin, but we are now in the process of expanding these parts of Music C•A•R•E•S and making them applicable beyond Berlin. As mentioned above, the example value theme has already been extended to Germany (as of 14.04.25). We will be working on the extent to which the whole thing can be used throughout Europe in the course of 2025. However, the tool is of course already available for stakeholders outside Berlin and Germany to test.
Classification in the tacho
- In the dark green area, you consume less than half the average consumption of an event of comparable size
- At the border between the light green and yellow area is the average consumption of an event of comparable size
- In the red zone, you consume more than twice the average consumption of an event of comparable size